April 2024
The Effect of Greenhouse Gases on the Earth’s Climate
Overview
The Earth’s climate is warming. Global warming is primarily due to an increase in the concentration of greenhouse gases in the Earth’s atmosphere. To be labeled a greenhouse gas, the gas must absorb infrared radiation (a.k.a. heat radiation) and have a long residence time in the atmosphere (a “lifetime” measured in years). This primer provides information on global temperature measurement, the Earth’s atmosphere, and greenhouse gases. Development of mitigation plans to slow or reverse the amount of greenhouse gases requires knowledge of the sources and sinks of greenhouse gases. Teledyne’s light sensing focal plane arrays (FPAs) are used in several space missions that measure the global distribution of greenhouse gases. An accompanying article on greenhouse gas missions presents several space-based instruments that use Teledyne’s visible and infrared FPAs.
The Earth's Temperature
The quantity that is most often referred to when speaking of climate change is the global average temperature anomaly, which is shown in the plot below. The plot presents the increase in global temperature since the pre-industrial reference level (chosen for this plot as the years 1850-1900) – the temperature difference is the “anomaly”. This plot provides one datum per year and does not show the seasonal variation of the Earth’s surface temperature.
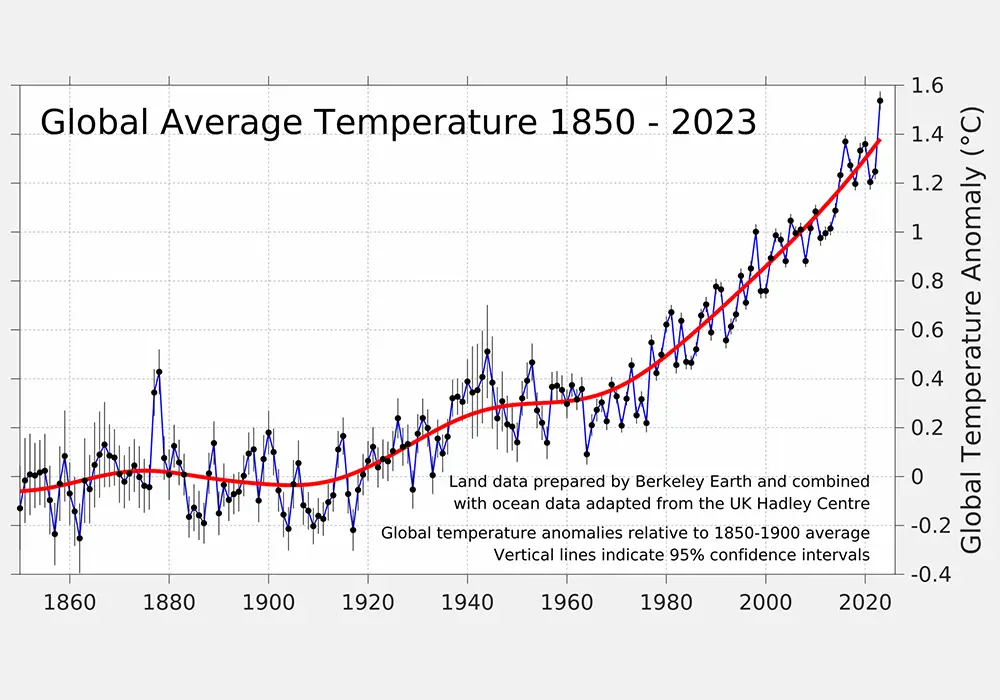
Global temperature anomaly for 1850-2023 with reference to the 1850-1900 pre-industrial period.
Credit: Berkeley Earth
The Earth’s temperature data comes from more than 32,000 land weather stations, weather balloons, ships and buoys, and satellites. These temperature measurements are combined to generate the global average temperature of air just above the surface of land and oceans.
The oscillations in temperature from year to year are caused by many factors including:
- the El Niño Southern Oscillation (ENSO),
- the 11-year sunspot cycle,
- volcanic eruptions (such as the January 2022 Hunga Tonga eruption), and
- reduction in sulfur aerosols due to 2020 commencement of new international rules reducing marine fuel pollution.
During 2023, all of these physical processes contributed to global warming and enhanced the 2023 temperature spike. These oscillations ride on top of the steady temperature increase due to greenhouse gases. The red line is a best fit curve to the oscillating temperature data.
Thickness of the Earth's Atmosphere
The Earth’s atmosphere is much thinner than many people may realize. As shown in the photo below, which was taken from the International Space Station, the Earth’s atmosphere is a thin layer of molecules held to the Earth by gravity. While molecules of the Earth’s atmosphere can be found hundreds of miles above the Earth, a widely accepted definition for the top of the Earth’s atmosphere is the von Kármán line at an altitude of 100 km (54 nautical miles, 62 miles, 330,000 feet) above mean sea level. More than 99.999% of the molecules in the Earth’s atmosphere are contained in the 62 mile layer between the Earth’s surface and the von Kármán line. Compared to the equatorial radius of the Earth (6,378 km), the atmosphere is only 1.5% the Earth’s radius. A good analogy is an apple; the atmosphere’s thickness compared to solid Earth is similar to the thickness of the skin of the apple to the apple.
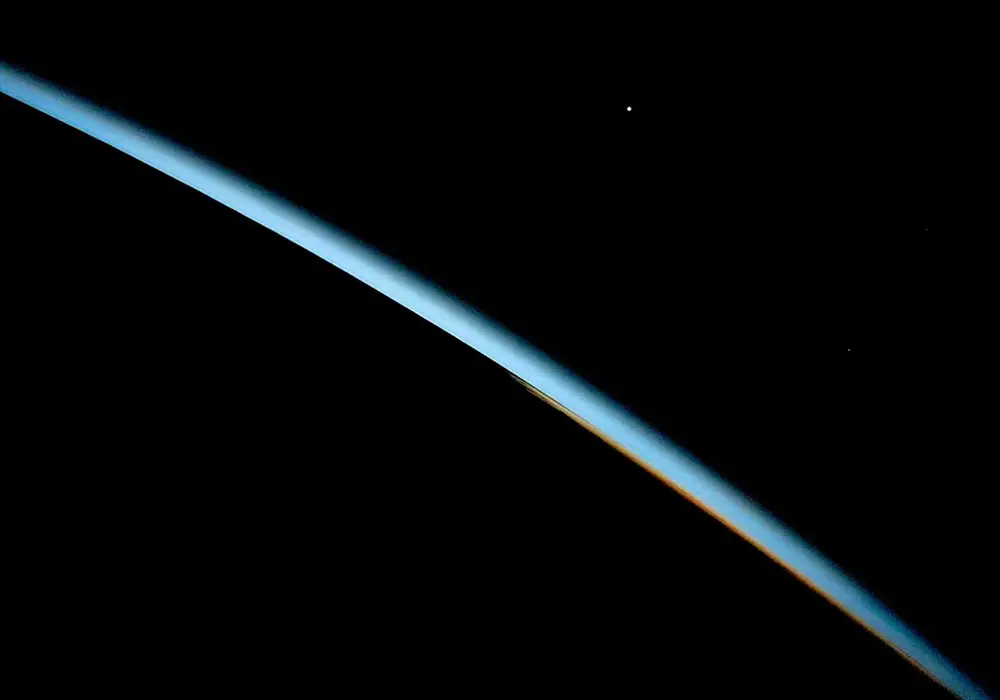
Earth's limb as seen from the International Space Station at dawn over the Pacific Ocean in May 2019. The thin layer of gases that make up the atmosphere is visible because the gas molecules scatter, absorb, and refract sunlight.
Credit: ISS Expedition 59 Crew. NASA
About 71% of the Earth’s surface is covered by water. By volume, water has nearly 5,000 times the heat capacity of air and the oceans serve as a buffer against rapid temperature changes in the atmosphere. About 90% of global warming is absorbed into the oceans, and daily sea surface temperature is a reliable gauge of how much and how quickly the planet is warming. The global ocean temperature data is derived from a combination of satellite, ship, and buoy observations. The plot below shows the increase in average temperature of the non-polar oceans since 1979. In this context, non-polar oceans are defined as those that reside within 60 degrees latitude of the equator.
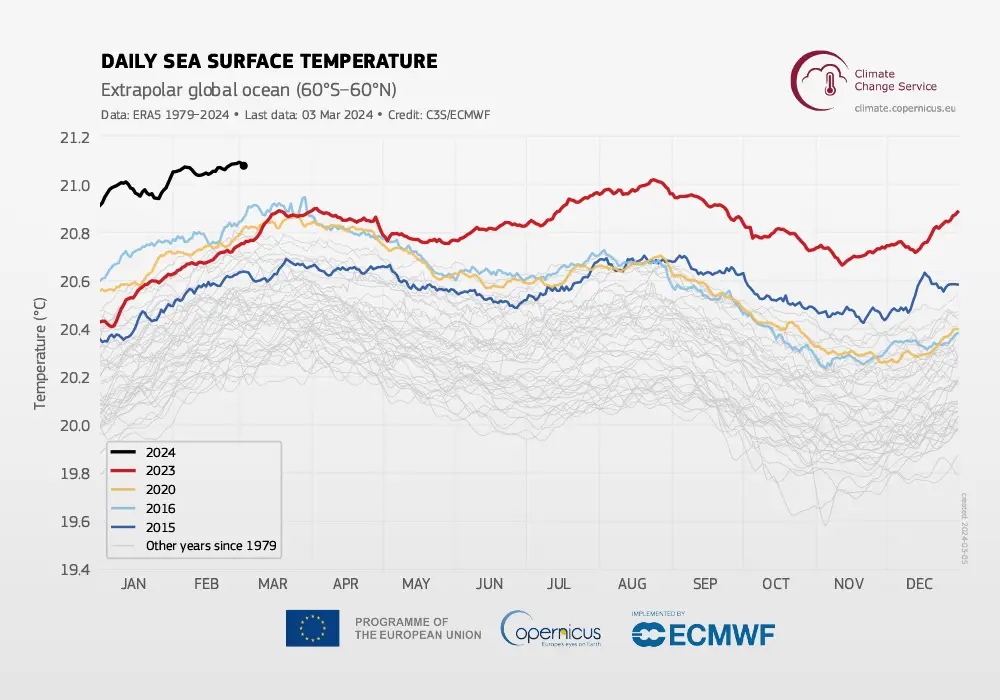
Daily sea surface temperature (°C) averaged over the extra-polar global ocean (60°S–60°N latitude) for 2015 (dark blue), 2016 (light blue), 2020 (yellow), 2023 (red), and 2024 (black line). All other years between 1979 and 2022 are shown with grey lines.
Data source: ERA5. Credit: Copernicus Climate Change Service/ECMWF
The Composition of the Earth's Atmosphere
Greenhouse gases are just a small fraction of the molecules in the Earth’s atmosphere. The Earth’s atmosphere is dominated by three gases; nitrogen, oxygen, and argon comprise 99.956% of the Earth’s air. The remaining 0.044% of the atmosphere is composed of carbon dioxide, neon, helium, methane, krypton, and hydrogen. See the bar graph below.
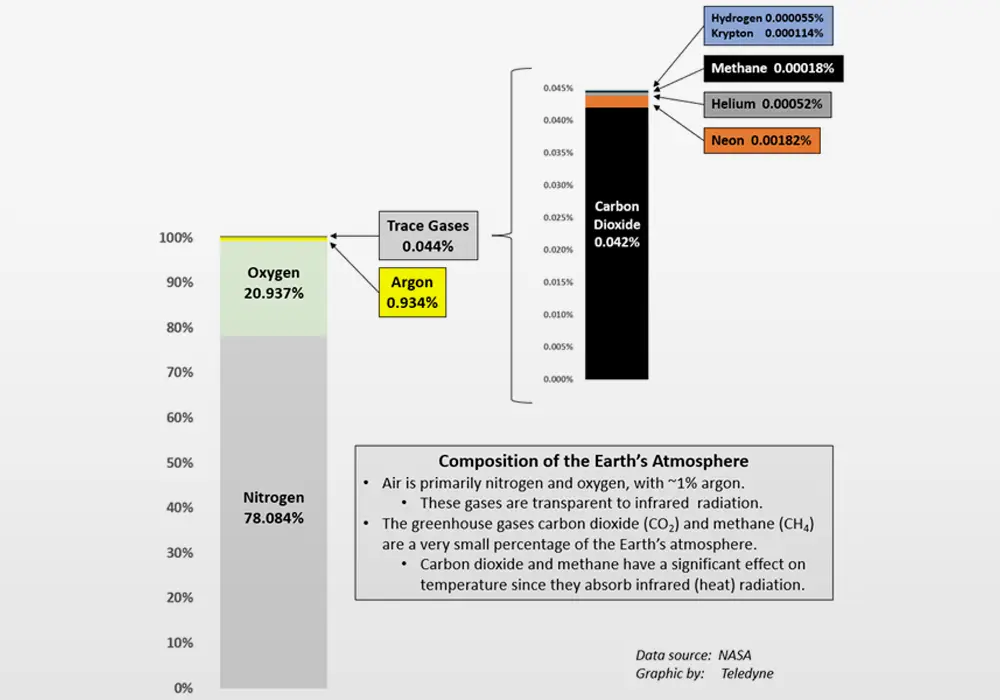
Composition of the Earth’s atmosphere.
Data source: NASA / Graphic by: Teledyne
Greenhouse gases are divided into two classes:
- “Natural” greenhouse gases that have existed in the Earth’s atmosphere for millions of years.
- Carbon dioxide (CO2), methane (CH4), and nitrous oxide (N20)
- “Industrial” greenhouse gases that were created by the chemical industry and were not present in the atmosphere before the mid-20th century.
- These are gases that contain bromine, chlorine, and fluorine.
Carbon dioxide (CO2) is the most significant of human-produced greenhouse gases and is the principal human produced driver of changes to Earth’s climate. The majority of CO2 emissions produced by humans are due to combustion of fossil fuels. Additional contributions come from cement manufacturing, fertilizer production, and deforestation. The content of CO2 in the Earth’s atmosphere has risen 50% since the start of the industrial revolution; the figure below shows CO2 since 1958. The concentration of CO2 has increased by more than one-third since 1958. The annual oscillation of the CO2 concentration (red curve in the plot at right) shows the plants on Earth breathing. As plants grow in the northern hemisphere summer, the plants absorb CO2 and the CO2 concentration decreases, reaching a minimum in September-October. In the northern hemisphere winter, many plants die and the atmospheric CO2 increases. Since 68% of the Earth’s land area is in the northern hemisphere, the annual breathing cycle is dominated by the northern hemisphere seasons. The red lines and symbols represent the monthly mean values, centered on the middle of each month. The black lines and symbols represent the same data after correction of the average seasonal cycle. The small vertical bars on the black lines of the plot at right show the uncertainty of each monthly mean.
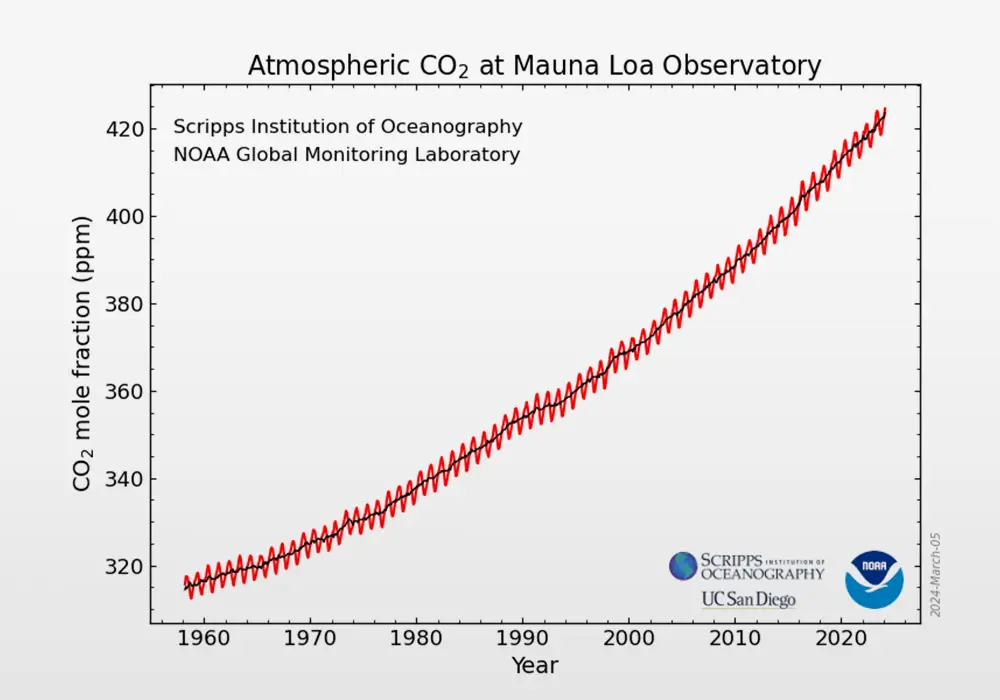
Source: Scripps Institute of Oceanography / NOAA
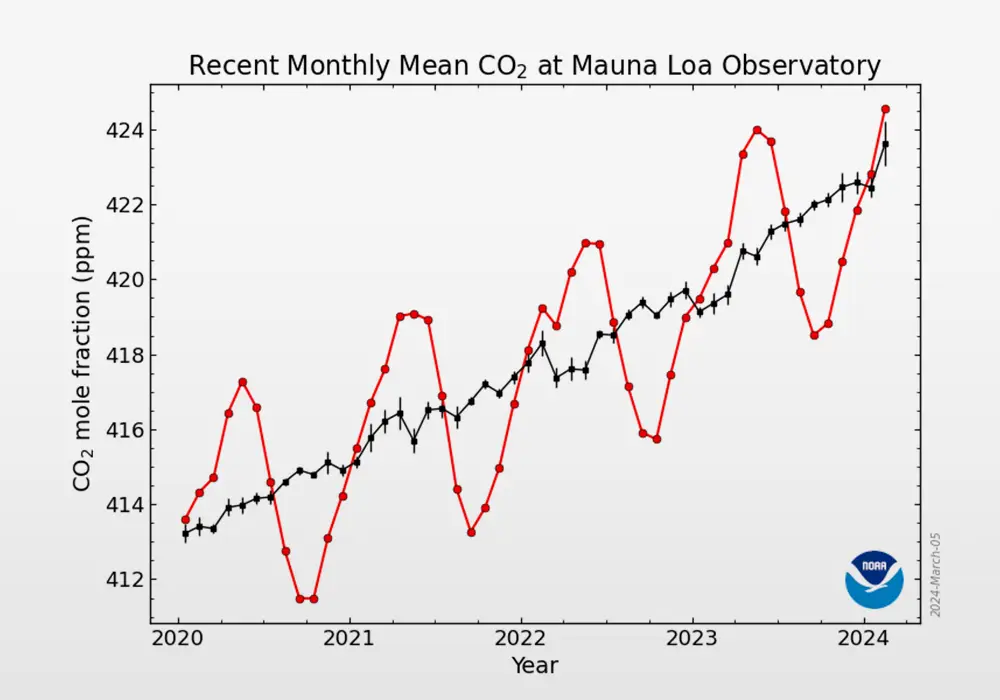
Source: Scripps Institute of Oceanography / NOAA
The left plot, called the “Keeling curve”, presents the longest set of continuous measurements of CO2 in the Earth’s atmosphere. The data is collected at the Mauna Loa Observatory, at altitude of 3,397 meters (11,141 feet), on the Big Island of Hawai’i. Mauna Loa was chosen as the long-term monitoring site due to its remote location far from continents and its lack of vegetation. The CO2 concentration (mole fraction) is measured in parts per million (ppm). The small vertical bars on the black line of the plot at right show the uncertainty of each monthly mean.
The curve is named for the scientist Charles David Keeling who started the monitoring program in 1958 and supervised it until his death in 2005. The Keeling curve is one of the more important scientific works of the 20th century since it was the first significant evidence of rapidly increasing CO2 levels in the Earth’s atmosphere.
Methane (CH4) is the second greatest contributor to global warming. Atmospheric methane has been measured since 1983, during which time the concentration of methane in the Earth’s atmosphere has increased by almost one-fifth. Over a 20-year period, methane is about 80 times as efficient as carbon dioxide at trapping infrared radiation. Human produced methane emitters are fossil fuel production / transportation (gas pipelines), waste facilities, and agriculture. Since methane has a much shorter lifetime than carbon dioxide, taking measures to reduce methane emissions can have the largest short term effect in slowing global warming.
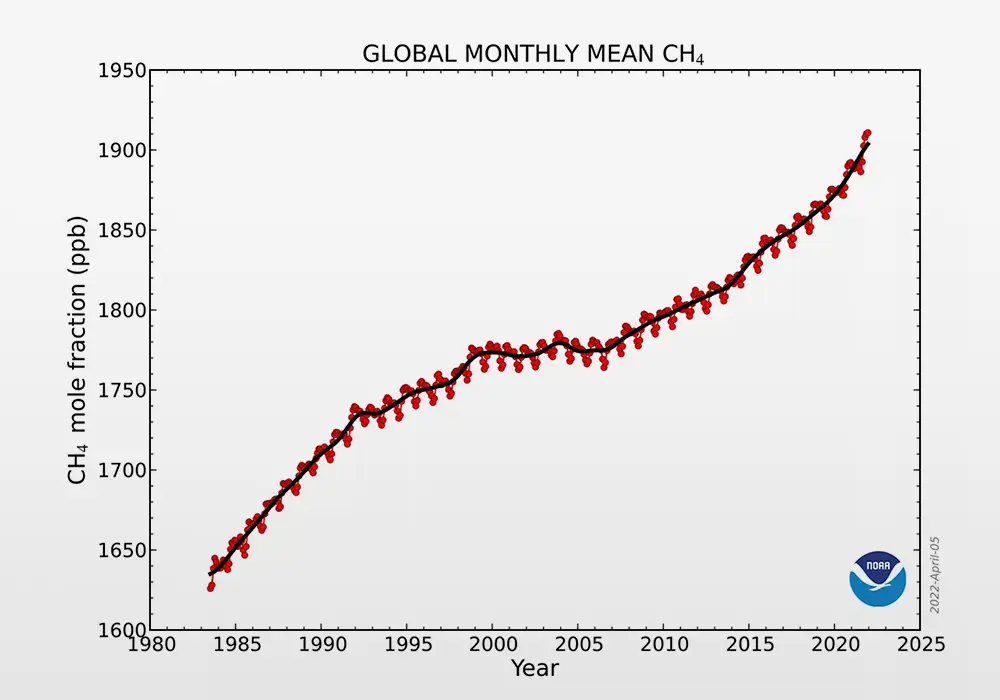
The average concentration of methane in the Earth’s atmosphere for 1983-2023. The CH4 concentration (mole fraction) is measured in parts per billion (ppb).
Source: National Oceanic and Atmospheric Administration (NOAA)
Climate Forcing by Greenhouse Gases
While the climate is a complex interplay of physical processes in the atmosphere, in the oceans, and on the Earth’s land surface, there are two clear facts about the Earth’s climate:
- The atmosphere and oceans are warming.
- The increased energy in the atmosphere and oceans is increasing weather extremes, such as extended periods of high summertime temperatures, extended drought, and excessive rain and flooding.
- Increases in the abundance of greenhouse gases since the start of the industrial revolution are mainly the result of human activity and are largely responsible for the increases in global temperature.
- Greenhouse gases are a major “forcing function” in the warming of our planet.
While climate modeling is difficult and predictions of future temperatures have an uncertainty on the order of 20%, the level of greenhouse gases can be precisely measured and scientists can fairly accurately calculate the extra heat retention in the atmosphere due to each gas.
The average solar irradiance that is absorbed at the Earth is 240 Watts per square meter (Watt·m-2). For the average temperature of the Earth to remain constant, radiant flux per unit area emitted from the top of the Earth’s atmosphere by long-wave infrared (heat) radiation should equal 240 Watt·m-2. Without any greenhouse gases, more energy would be emitted by the Earth than is absorbed until the Earth cooled to an average temperature of -18°C (-0.4°F), at which point the Earth’s radiation budget would be in balance. However, at -18°C, our planet would be an icy wasteland. Thus, greenhouse gases are necessary and important, but for a stable climate, greenhouse gases need to exist at the right concentration.
- The average temperature of the Earth today is about 15°C (59°F).
If greenhouse gas concentrations are too high, the atmosphere will trap too much long-wave infrared radiation and create an energy imbalance that increases global temperature. This imbalance is termed the “forcing function” or “enhanced greenhouse effect”. The plot below shows the cumulative forcing function due to greenhouse gases, expressed in Watt·m-2. This forcing function is the excess energy that must be stored in the Earth’s atmosphere, oceans, and land mass. The horizontal arrow at 2.4 Watt·m-2 that intersects the total forcing function in the year 1990 corresponds to 1% of the absorbed solar radiation.
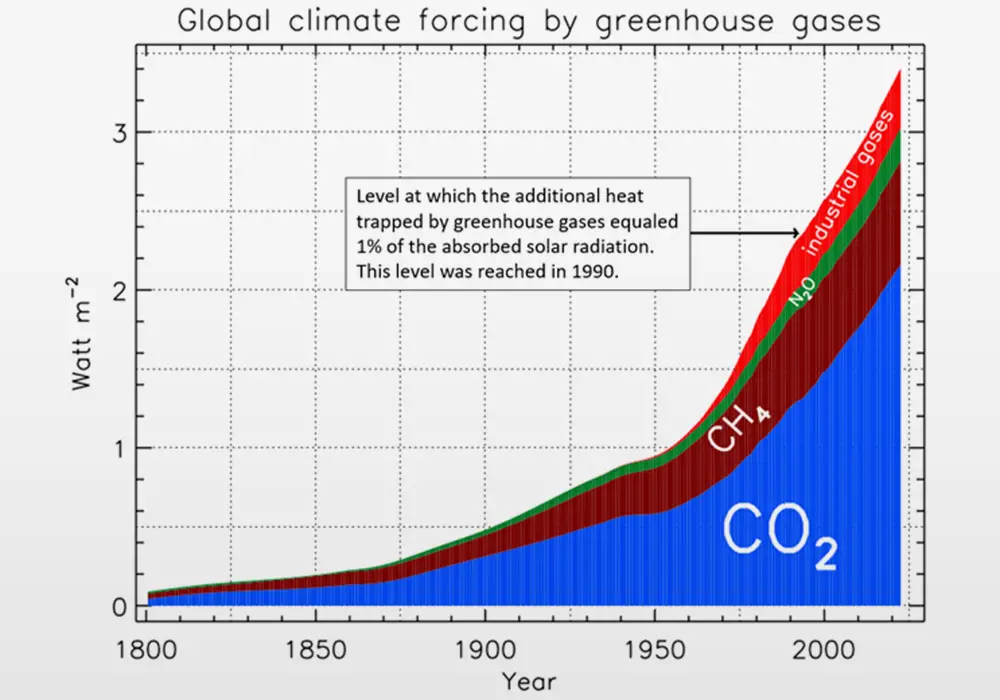
Radiative climate forcing by all greenhouse gases since pre-industrial times through 2022. The horizontal arrow shows where climate forcing surpassed 1% of Earth’s weather and climate engine.
Source: National Oceanic and Atmospheric Administration (NOAA)
In 2022, the total radiative forcing was 3.404 Watt·m-2. Multiplied by the surface area of the Earth, the excess energy is 1,736 TeraWatt (TW, 1012 W). To get a sense of that level of energy increase, consider the following:
- A large power plant produces 1 GigaWatt (GW, 109 W) of energy. The excess heat retention due to greenhouse gases in 2022 equaled the electrical output of 1.74 million large power plants.
- All of the power plants in the world generated 3.33 TW in 2022, only 0.19% of the heating produced by greenhouse gases.
- All heat produced in 2022 from all human energy uses – electricity production, nuclear, transportation, heating and cooling of buildings, industrial processes, biofuels, and waste – totaled 20.5 TW. Heat retention by greenhouse gases in 2022 was 85 times larger than all of the direct heat produced by humanity.
Measuring Greenhouse Gases from Space
To develop greenhouse gas mitigation strategies, it is important to not only know the average concentration of gases but to understand where the greenhouse gases are produced (“sources”) and where greenhouse gases are absorbed (“sinks”). A global view of greenhouse gases is most efficiently generated by space-based instruments flying in low Earth orbit (LEO). Teledyne is playing a key role in several space missions that are measuring greenhouse gas concentration, distribution, and sources and sinks. The accompanying article on greenhouse gas space missions discusses the following space missions that use Teledyne’s light sensing focal plane arrays (FPAs):
| NASA's Orbiting Carbon Observatories -2 and -3 |
Operational |
| NASA's EMIT (Earth Surface Mineral Dust Source Investigation) |
Operational |
| MethaneSat - funded by the Environmental Defense Fund |
March 2024 Launch |
| Carbon Mapper - funded by philanthropic sources |
Planned 2024 launch |
| ESA's CO2M |
2025 launch |

